
This post is a condensed version of our research provided to Offchain and the broader Arbitrum DAO on June 19th, 2026. The complete report is available here.
Arbitrum One is one of the largest Ethereum L2s, and how it prices blockspace determines both how much activity the chain can process and how much revenue the DAO collects from transaction fees. ArbOS 61 Elara includes a multi-dimensional dynamic pricing path (otherwise referred to as Dynamic Pricing), where fees can respond to separate L2 resource gas targets rather than a single aggregate gas target. As part of Entropy’s Advisory services, the team assisted Offchain with evaluating the potential DAO revenue and chain capacity impact of activating this path.
- Chain Revenue: whether activated multi-gas pricing can preserve L2 fee revenue at, or close to, post-ArbOS 51 levels.
- Chain Capacity: whether activating multi-gas pricing can increase effective chain capacity, measured as the L2 gas that can fit before transaction fees rise above the min base fee.
Main Findings
The Offchain research team specified two candidate resource-aware activation configurations for this study. Under the study assumptions, activation would increase effective capacity and reduce severe congested-day fee spikes, while lowering L2 fee revenue unless the min base fee is raised.
- In terms of chain capacity:
- If activated, the modeled ArbOS 60 multi-gas pricing design would raise median effective capacity by about 62% over the full window versus ArbOS 51; the modeled median gain is about 131% pre-ArbOS 51 and about 62% post-ArbOS 51.
- In terms of DAO revenue from L2 Transaction Fees:
- ArbOS 51 reduced transaction costs for users, while also reducing DAO L2 fee revenue in the observed period. If multi-dimensional pricing is activated, the calibration objective is to use available levers, including min base fee, to increase chain capacity while keeping DAO revenue at or close to ArbOS 51 levels; this is an activation target, not a result of the historical simulation.
- The study uses two historical simulations with a re-created multi-gas pricing model: a simulation of observed transactions without elasticity and an elasticity-adjusted stress test by wallet segment.
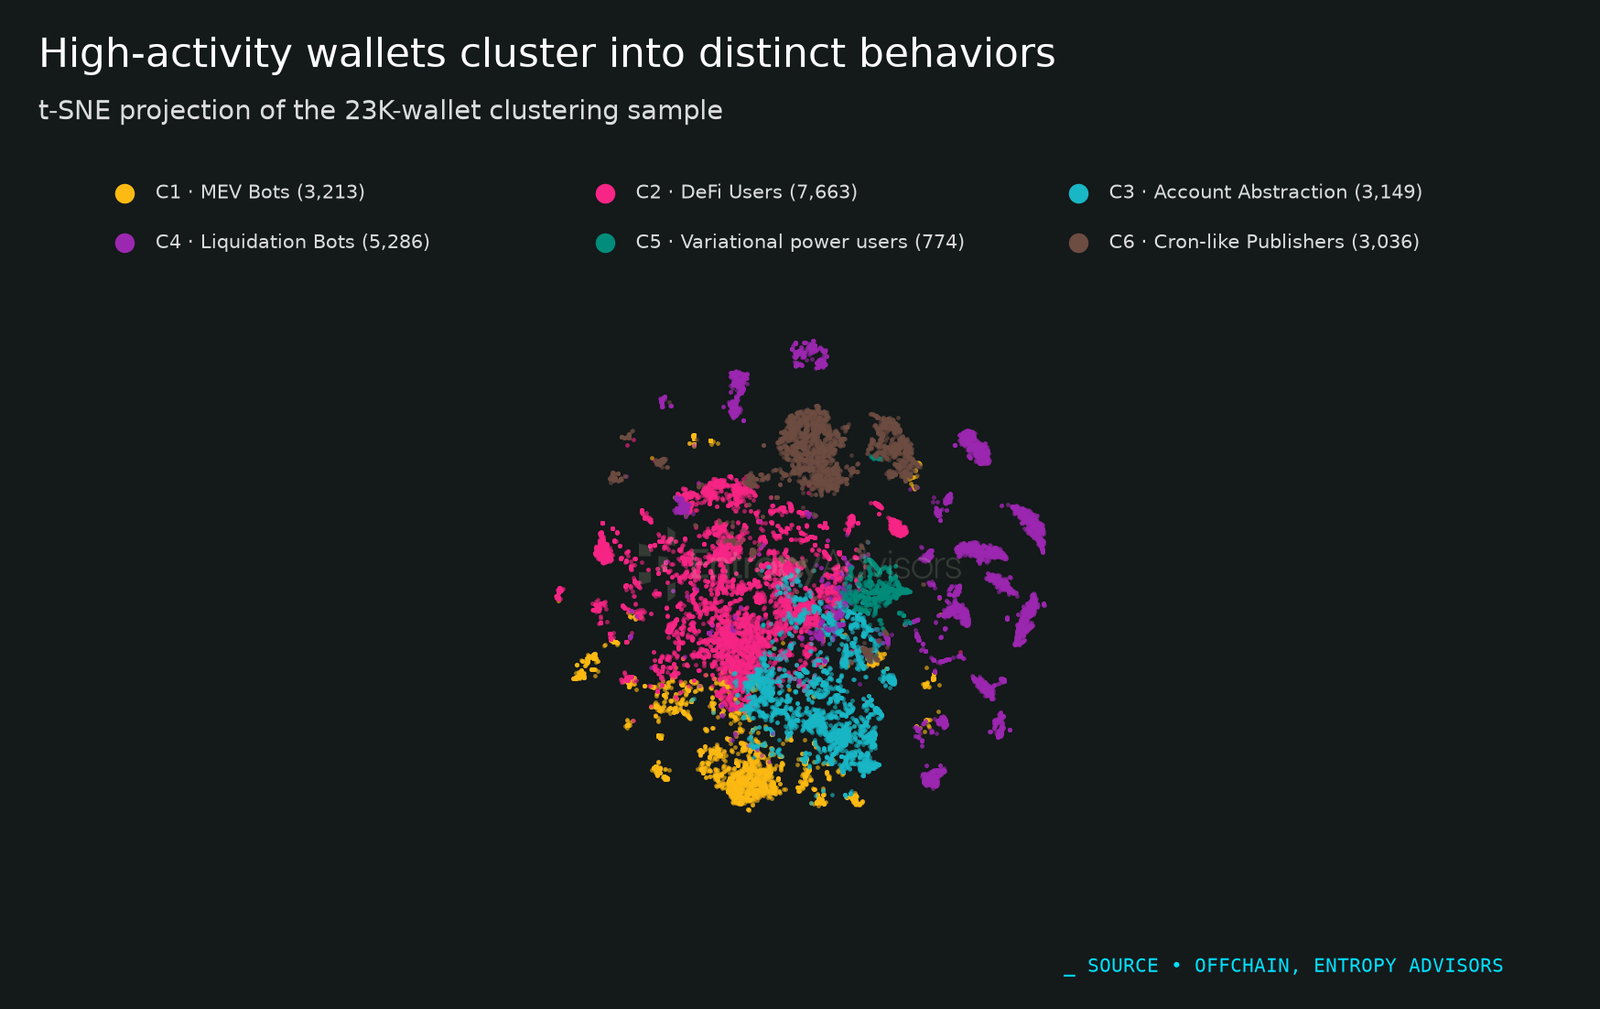
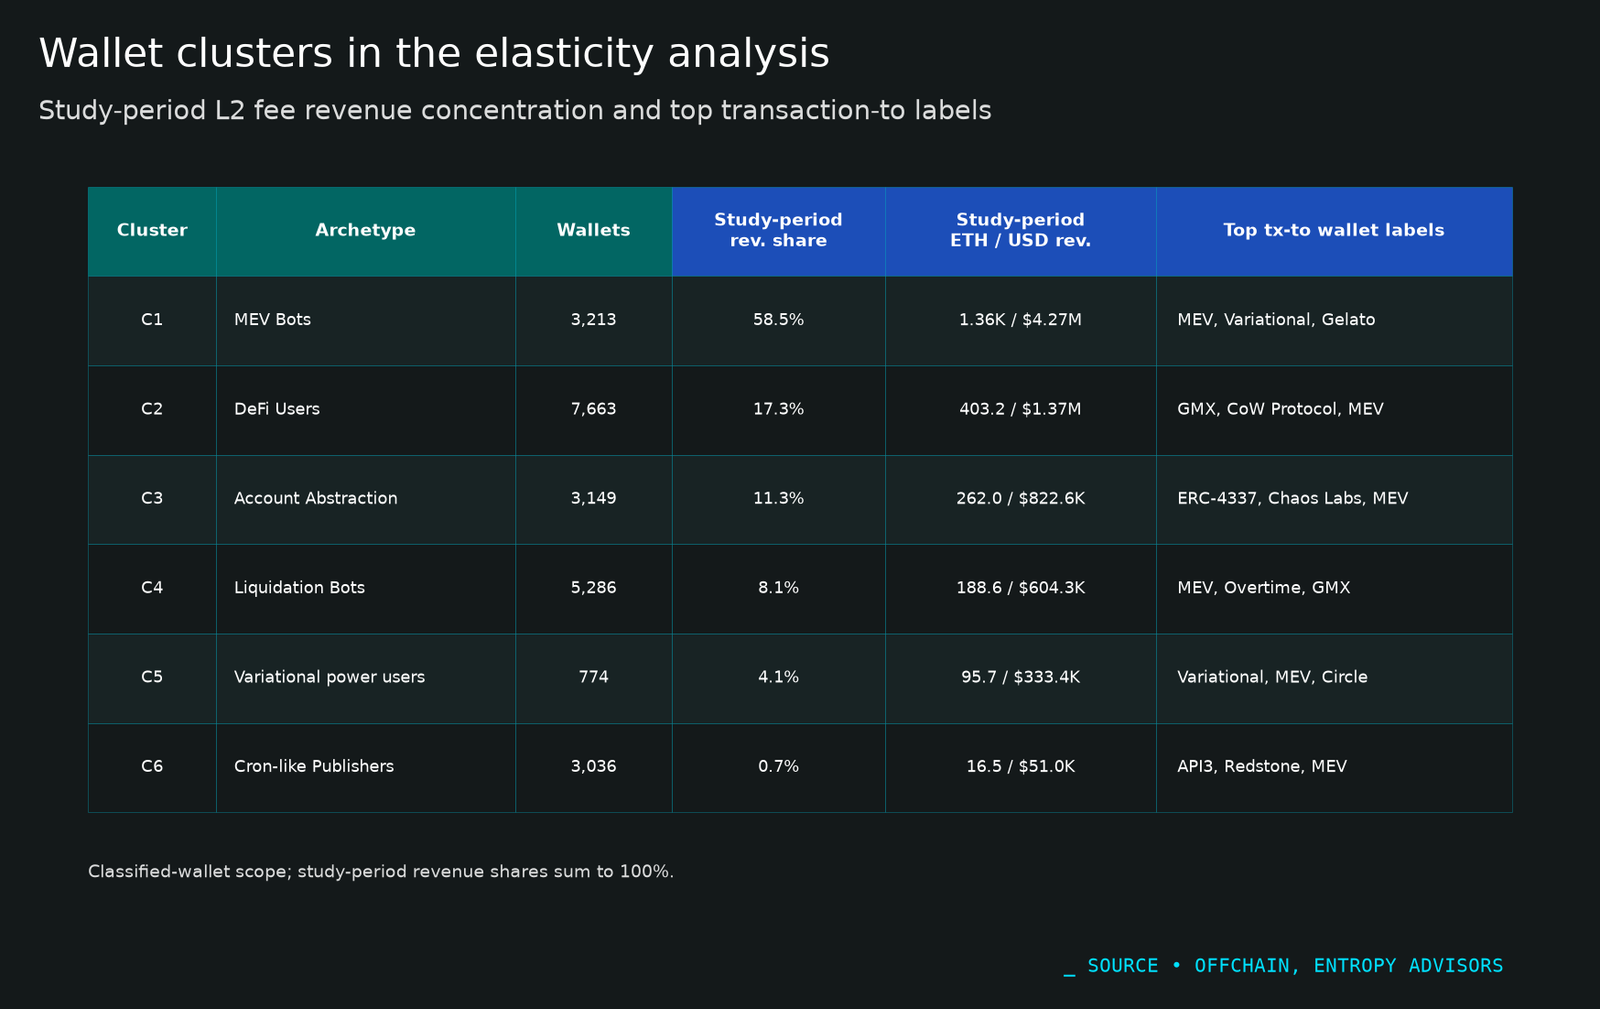
- For the elasticity-adjusted stress test, we group high-activity wallets into clusters: sets of wallets with similar transaction behavior, resource usage, and counterparty-label patterns. Within that classified-wallet scope taking the elasticity-adjusted stress test, the first two revenue-share clusters are the primary readout: C1 MEV Bots account for 58.5% of classified L2 fee revenue and carry the largest churn risk if multi-dimensional pricing got enabled, while C2 DeFi Users account for 17.3% and show limited modeled churn through the displayed range. This implies that C1 MEV Bots are more price sensitive than C2 DeFi Users and enabling multi-dimensional pricing will reduce C1 MEV Bot activity & their contribution to classified L2 fee revenue.
Methodology
The analysis covers 2025-10-01 to 2026-04-28, a 210-day window with 72.6M blocks, 654.3M transactions, 13.4M active wallets, and 90.6M Mgas of priced gas. The ArbOS 51 pre/post comparison splits that window at the launch, with the pre-launch period running to 2026-01-08 and the post-launch period from 2026-01-09. Data sources include observed Arbitrum activity and L2 fee data, Dune DAO revenue queries, CoinGecko ETH/USD prices, wallet and activity labels, and per-transaction gas-resource breakdowns provided by Offchain from a recent Nitro node. We report aggregated findings only.
The study runs two historical simulations that re-price the observed workload under a re-created multi-gas pricing model, one without elasticity and one with. In the without-elasticity simulation, realized gas usage is held fixed and only the pricing function and min base fee change, which isolates the mechanical effect of the pricing change. In the elasticity simulation, observed gas is adjusted by wallet-segment elasticity assumptions to stress-test gas retention and churn risk. Both candidate configurations omit L1 calldata.
Background on DAO Revenue and ArbOS 51
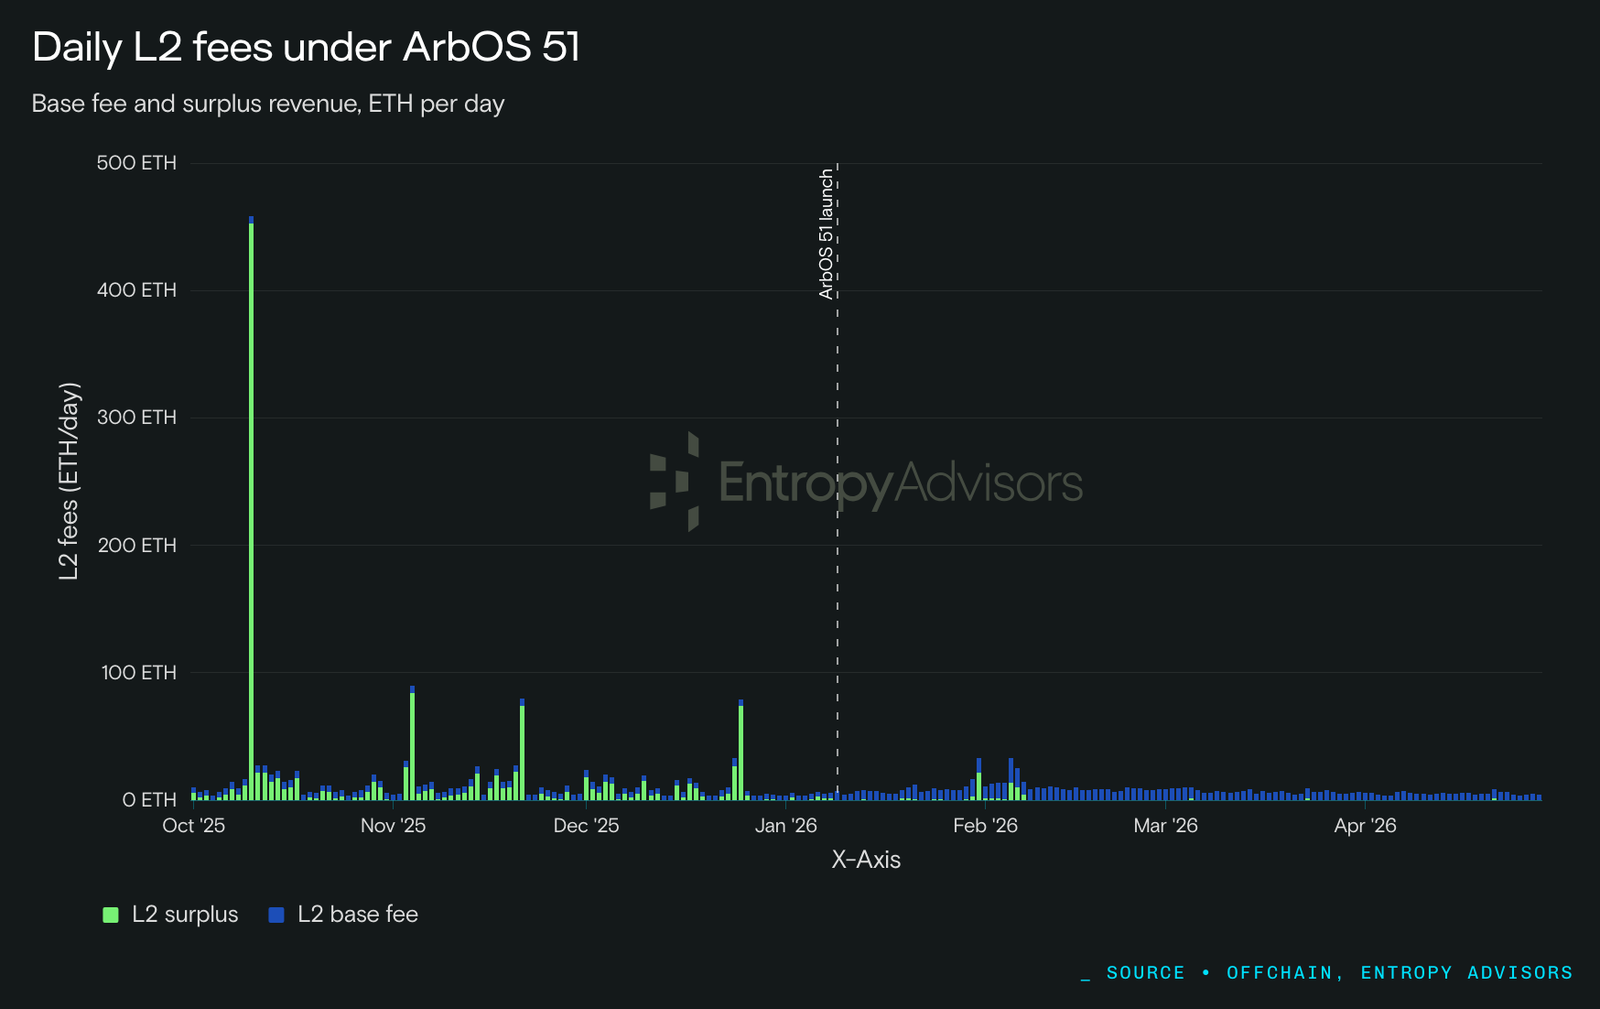
Over the 2025-10-01 to 2026-04-28 window, L2 base fee plus L2 surplus accounted for about 69% of total DAO revenue in ETH and about 71% in USD. Prior to the activation of ArbOS 51, the surplus fee’s share was about 72% in ETH and 73% in USD; after ArbOS 51, it dropped to about 65%. The remaining DAO revenue in this chain-revenue scope came from L1 surplus, Arbitrum Chain license fees, and Timeboost; it excludes external DAO revenue streams such as treasury portfolio income.
The ArbOS 51 launch coincided with lower transaction costs and fewer congested days. The analysis defines a congested day as one where at least 5% of the day's L2 fees came from surplus pricing above the min base fee.
Gas Usage Context
The resource view below uses the per-transaction gas-resource breakdown provided by Offchain from a recent Nitro node. It maps priced activity into the resource dimensions used by the candidate multi-gas model, including computation, storage read/write/growth, history growth, and Call Data-related gas.
Using the same day-level ArbOS 51 split as the rest of the study, median daily priced gas was about 492k Mgas/day before ArbOS 51 and about 369k Mgas/day after ArbOS 51.
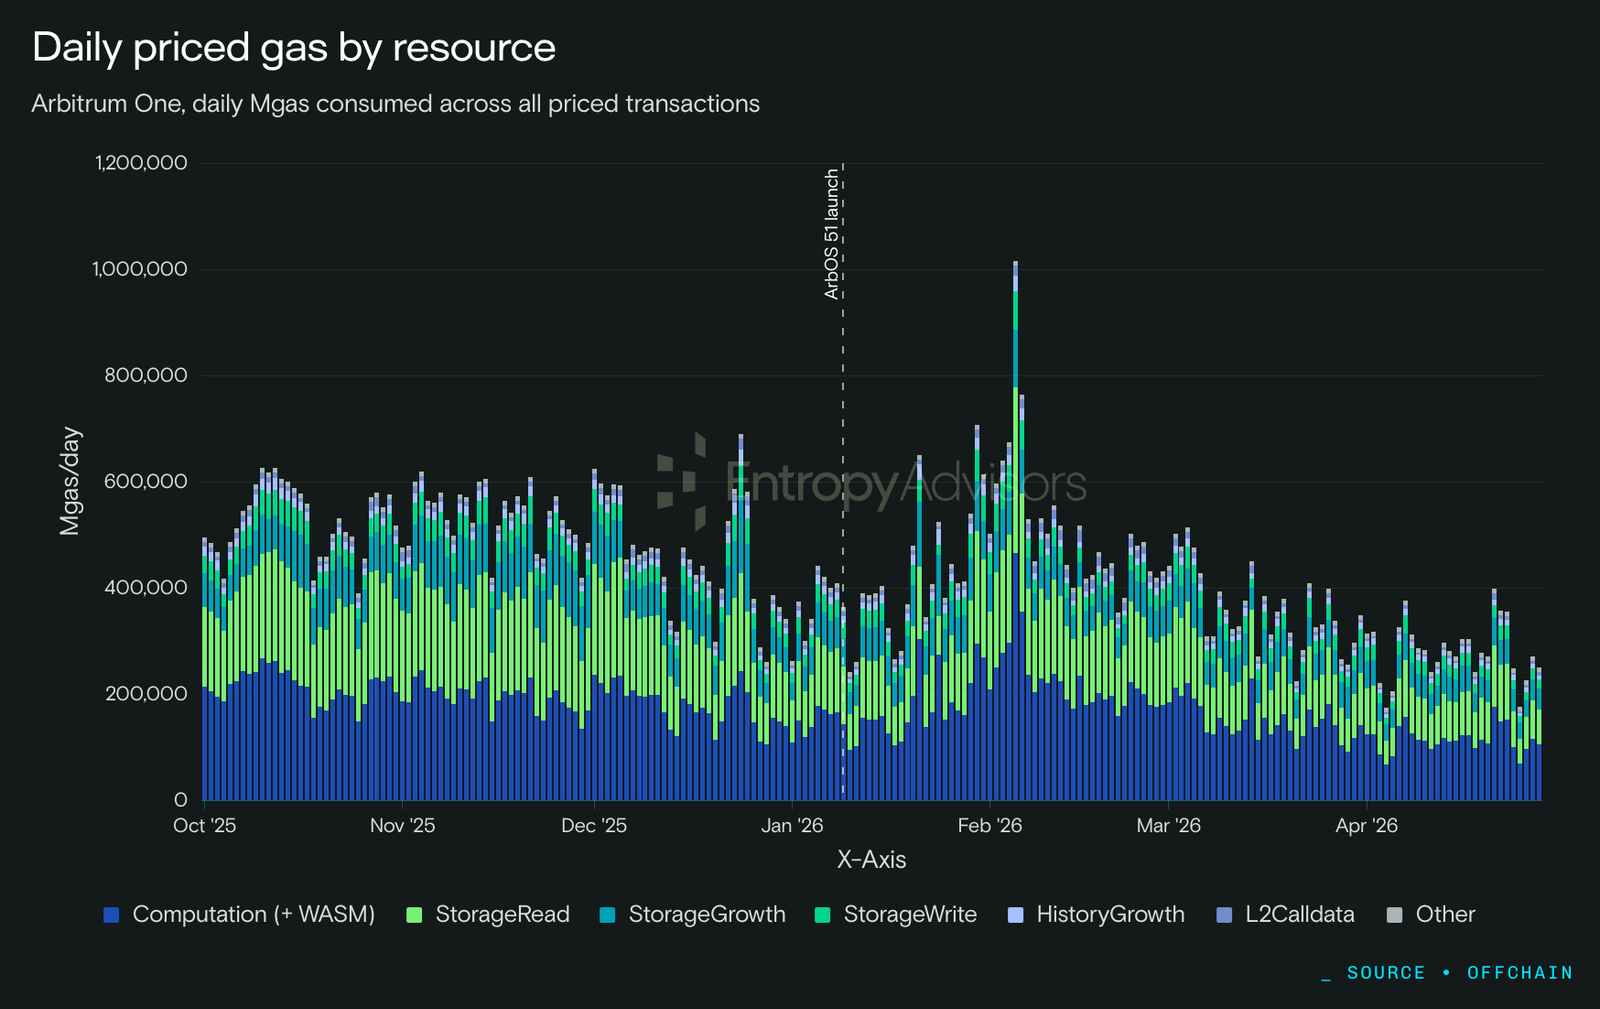
Total priced gas declined over the study window: the full-period linear trend falls from about 561k to 302k Mgas/day (-46%), while the 7-day moving average moves from about 457k to 222k Mgas/day (-51%). Even with that lower aggregate volume, the daily resource mix stayed stable.
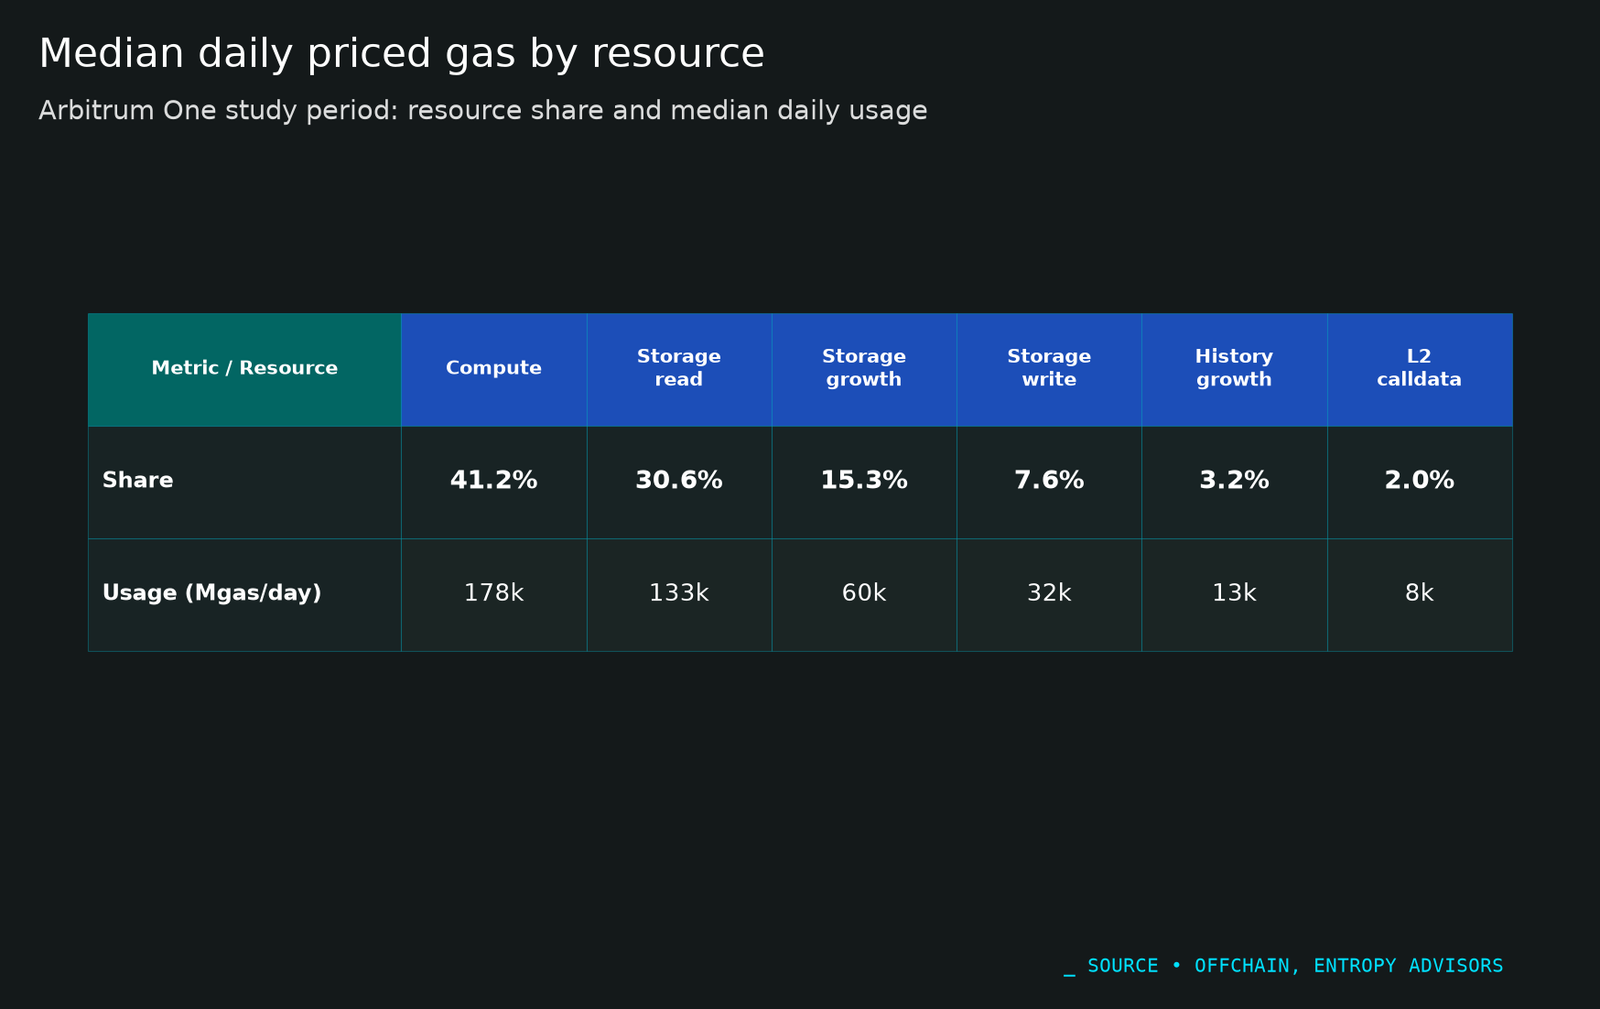
Under multi-resource pricing, the binding constraint depends on which resources are being consumed, not only the aggregate gas volume.
ArbOS 51 provides the baseline dynamic-pricing controller for this comparison. It uses a single backlog controller, where usage above target builds backlog and raises the base fee above the min base fee, and usage below target drains backlog toward the floor. Before ArbOS 51, the controller used a single 7 Mgas/s target over a 102-second adjustment window at a 0.01 gwei floor. The ArbOS 51 configuration raised the floor to 0.02 gwei and replaced the single target with a six-step ladder, stepping the target up from 10 to 60 Mgas/s while the adjustment window shortens from 86,400 seconds at the first step down to 9 seconds at the last, so that sustained congestion tightens the response progressively.Candidate ArbOS 61 Multi-Gas Pricing Sets
The analysis models two candidate ArbOS 61 dynamic-pricing activation configurations specified by the Offchain research team. The multi-gas pricing path is included in ArbOS 61 on Arbitrum One but remains inactive.
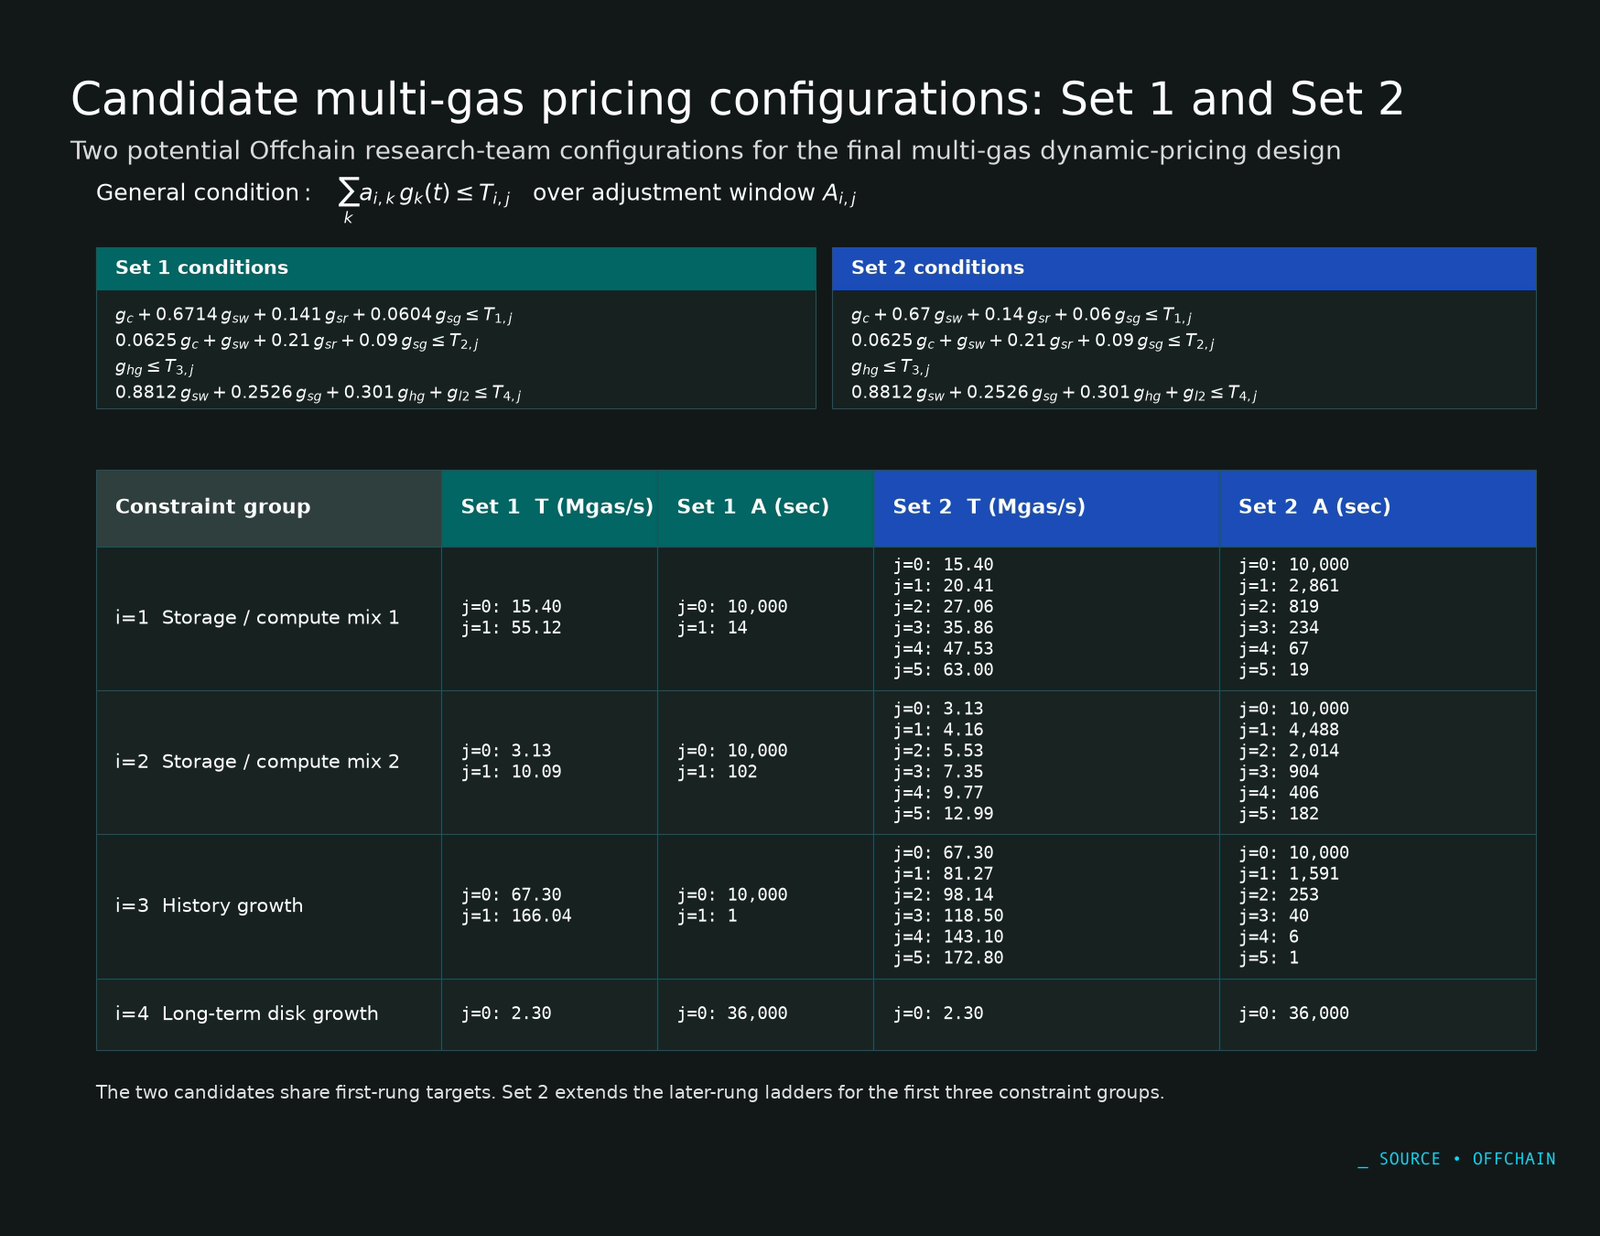
Both configurations price six L2 resources: computation, storage write, storage read, storage growth, history growth, and L2 calldata. Each configuration applies four constraint groups: storage/compute mix 1, storage/compute mix 2, history growth, and long-term disk growth. Each group requires that a weighted sum of resource gas stay below a target over a corresponding adjustment window, with the exact weights, targets, and windows shown below.
The two activation configurations differ mainly in the target/window ladders applied after the backlog begins to build.
- Set 1 is the default targeted activation configuration. It uses shorter ladders for each constraint group.
- Set 2 is the alternative activation configuration. It keeps the same first-ladder targets but extends the storage/compute and history-growth ladders across more ladders.
- The headline capacity comparison is similar because the first-ladder targets are the same; the configurations mainly diverge after later ladders become active.
The exact weights, targets, and windows for both are shown below.
Multi-Gas Pricing Simulation without Elasticity
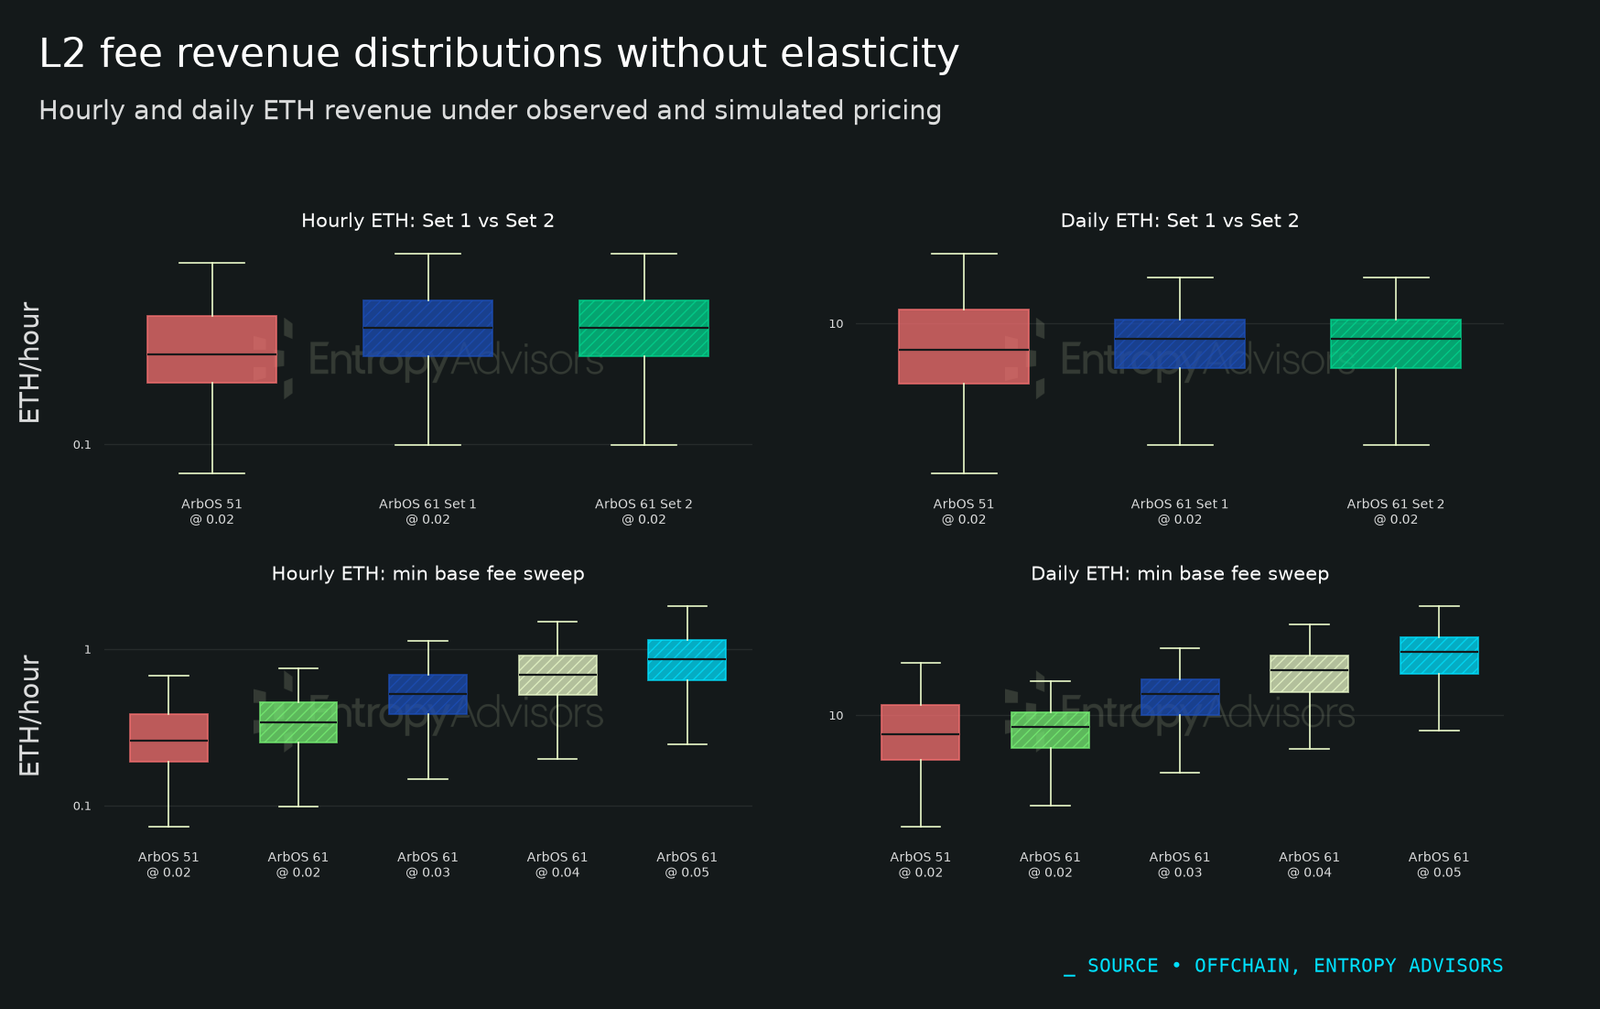
This section is a baseline simulation without elasticity, not a forecast of realized behavior after activation. It re-prices the historical workload under candidate multi-gas pricing while holding observed gas unchanged; only pricing mechanics and min base fee vary. Higher min base fee rows are hypothetical comparisons, with elasticity handled separately in Sections 5 and 6.
At a min base fee of 0.02 gwei, activating ArbOS 60 multi-gas pricing would materially reduce full-window L2 fee revenue, because the multi-resource constraints collect less on congested days. In the simulation without elasticity, activated Set 1 generates 1.81K ETH over the full window against 2.87K ETH for the onchain ArbOS 51 baseline, a 36.8% reduction, and Set 2 produces effectively the same result. The gap is concentrated around congested periods and persists across the full window, as Figures 3 and 4 show. Raising the floor recovers revenue on a predictable path, with full-window parity against the ArbOS 51 baseline landing near 0.032 gwei for both sets; the higher-floor rows are hypothetical comparisons, since demand response at those floors is handled separately in Sections 5 and 6.
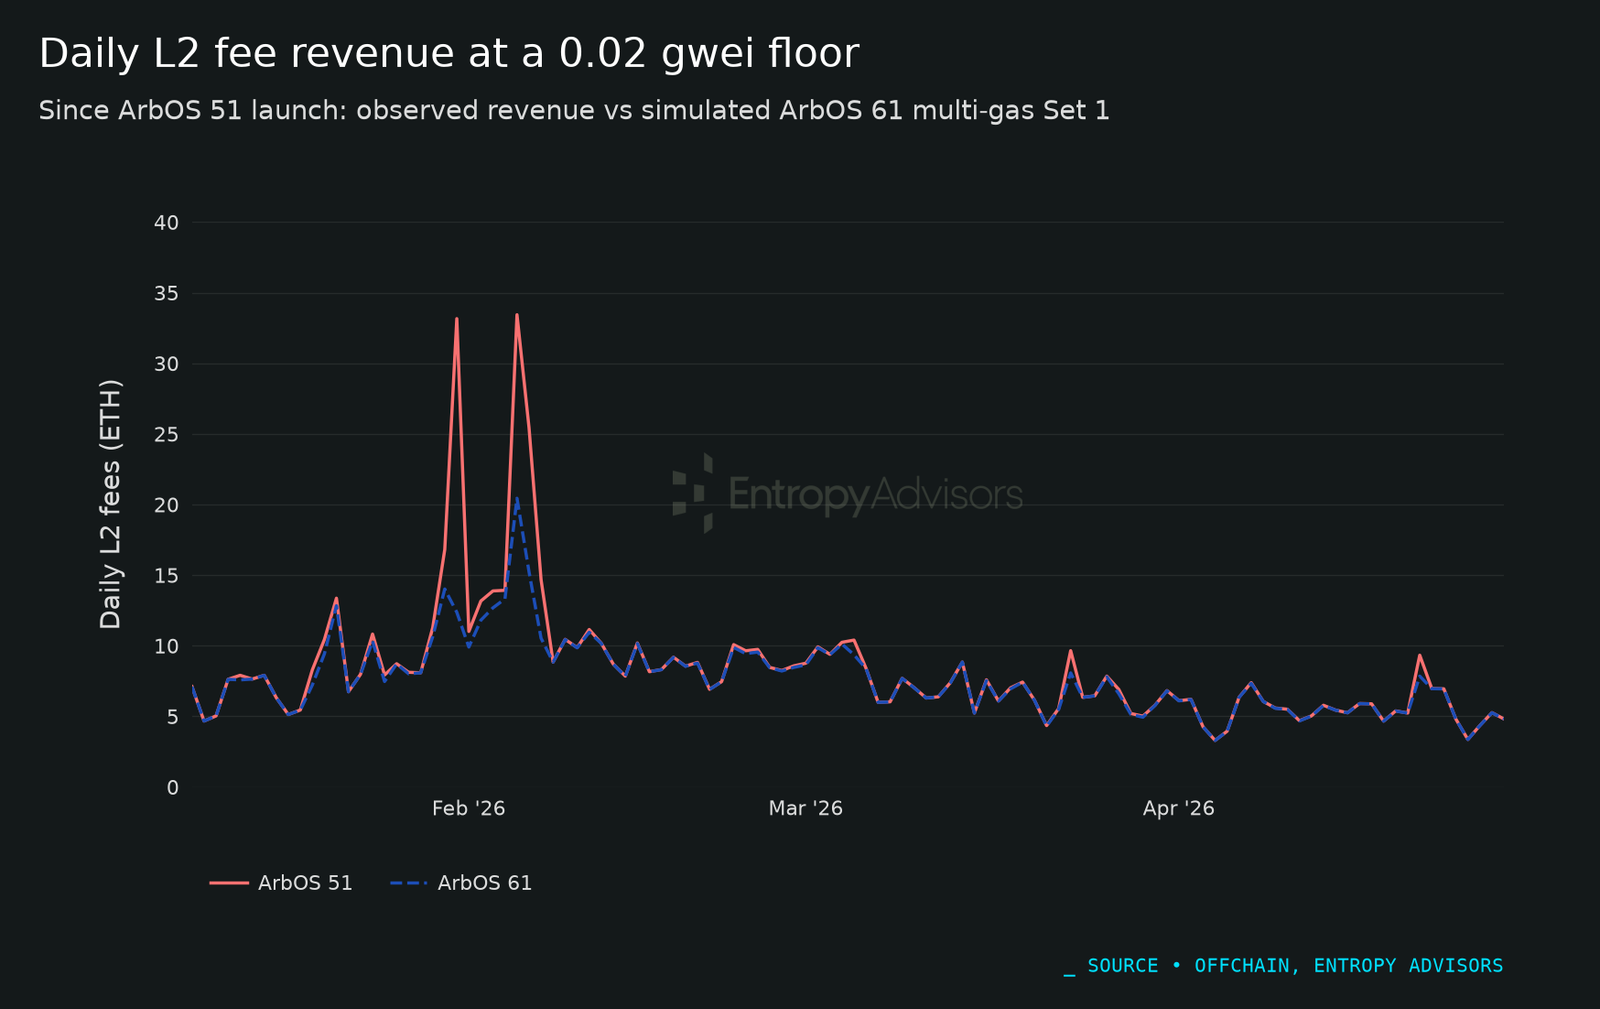
The daily view shows the revenue gap without elasticity is concentrated around congested periods.
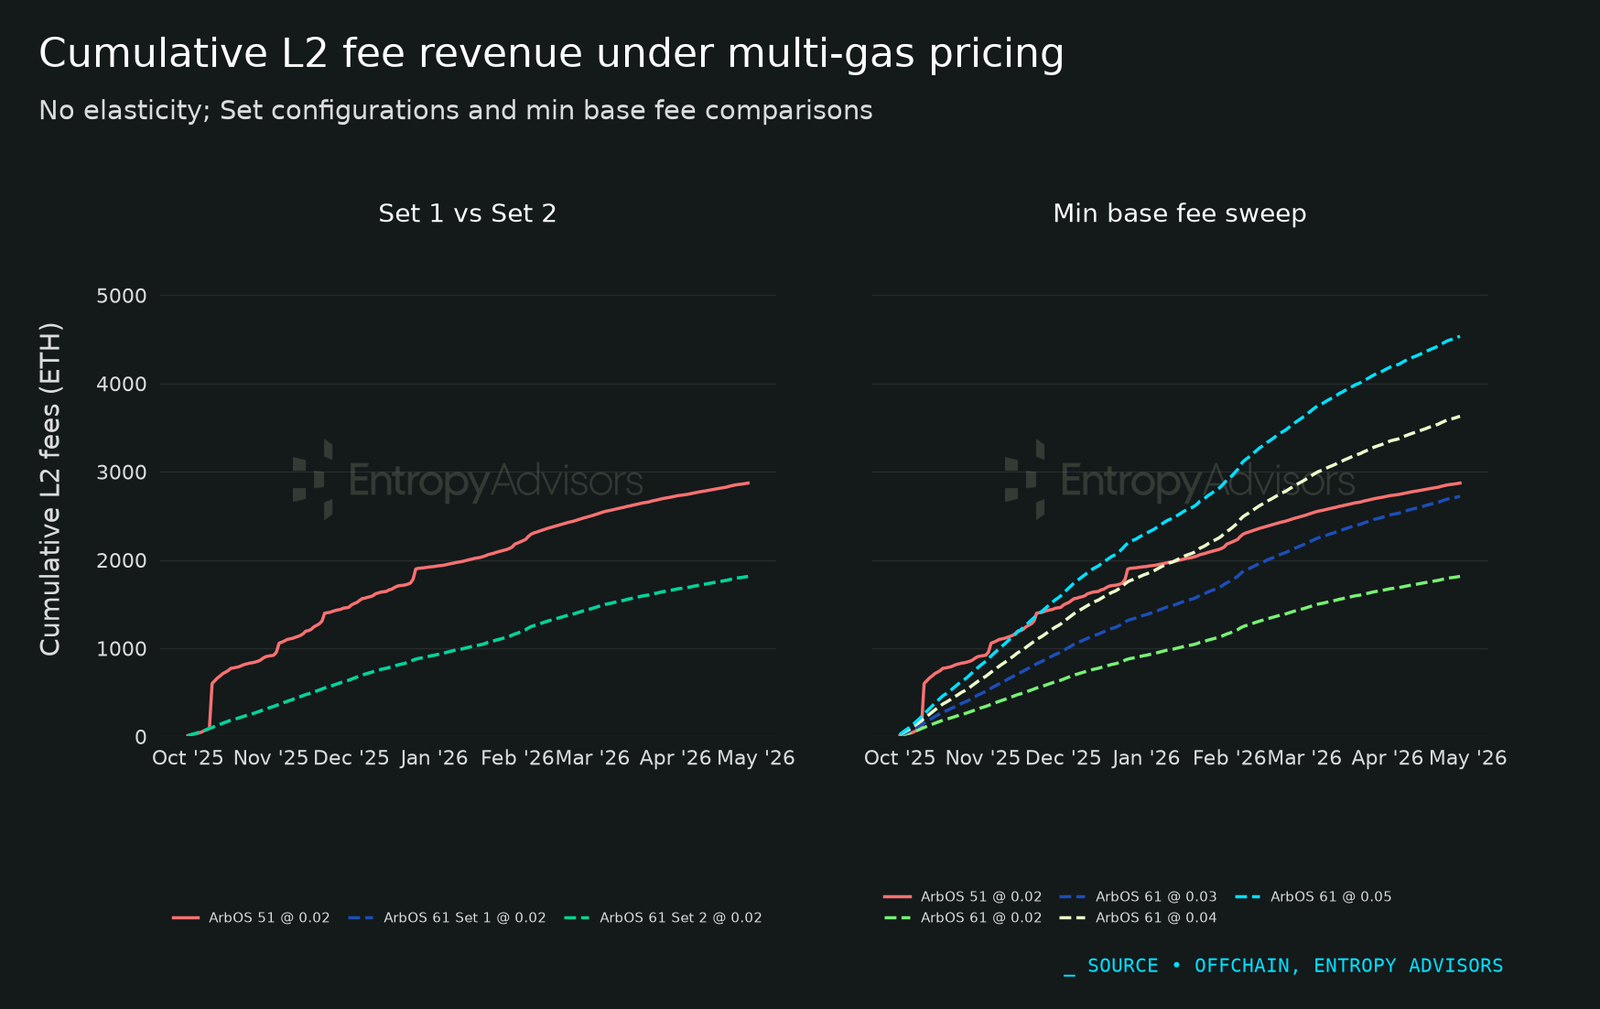
The cumulative view shows that the gap persists across the full study window.
Elasticity-Adjusted Gas Retention
The elasticity analysis stress-tests how much historical gas would be retained if a higher min base fee changed realized prices under the re-created multi-gas pricing model.
The elasticity methodology utilized in this study was inspired by research from the Offchain team, specifically the approach detailed in their paper available at https://arxiv.org/pdf/2606.13555.The first step was to group active wallets into six K-Means clusters using standardized wallet features, including resource mix, gas per transaction, transaction frequency, active hours, gas variability, high-fee exposure, reverts, and spam indicators. The clustering sample includes 23,121 wallets with at least 500 transactions during the period; these wallets account for more than 85% of L2 fee revenue in the study window.
Clustering separates wallets with different gas-usage patterns before estimating elasticity. A chain-wide estimate would average together different use cases: MEV bots, DeFi users, account abstraction wallets, liquidation bots, bursty power users, and cron-like publishers should not be expected to respond to price changes in the same way.
First, the 2SLS first stage isolates fee variation driven by the instrument:

All variables in the first stage are interpreted after wallet and hour demeaning. The lagged fee term, log pi,t−1, is the instrument. The fitted first-stage values capture only fee variation driven by that instrument. In the second stage, the observed fee term is replaced with the fitted fee values.
The second step estimates an elasticity matrix by cluster and resource using a two-way fixed-effects IV regression. For wallet w, hour h, cluster c, and resource k, the model is:
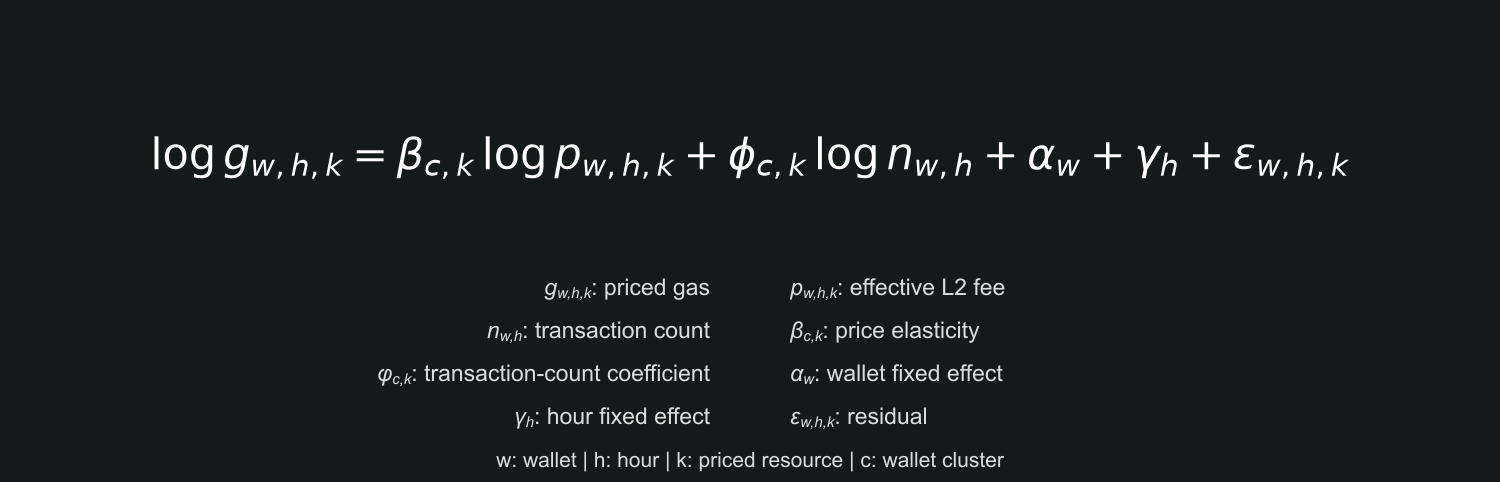
Here g is hourly resource gas, p is the effective resource price, n is the wallet's transaction count in the same hour, αw and γh absorb wallet and hour fixed effects, and βc,k is the elasticity used in the gas-retention stress test, and finally εw,h,k the error term.
The price term log pw,h,k is instrumented with the wallet's lagged log fee for the same resource, and the model is estimated on wallet-hours with non-zero usage of that resource.
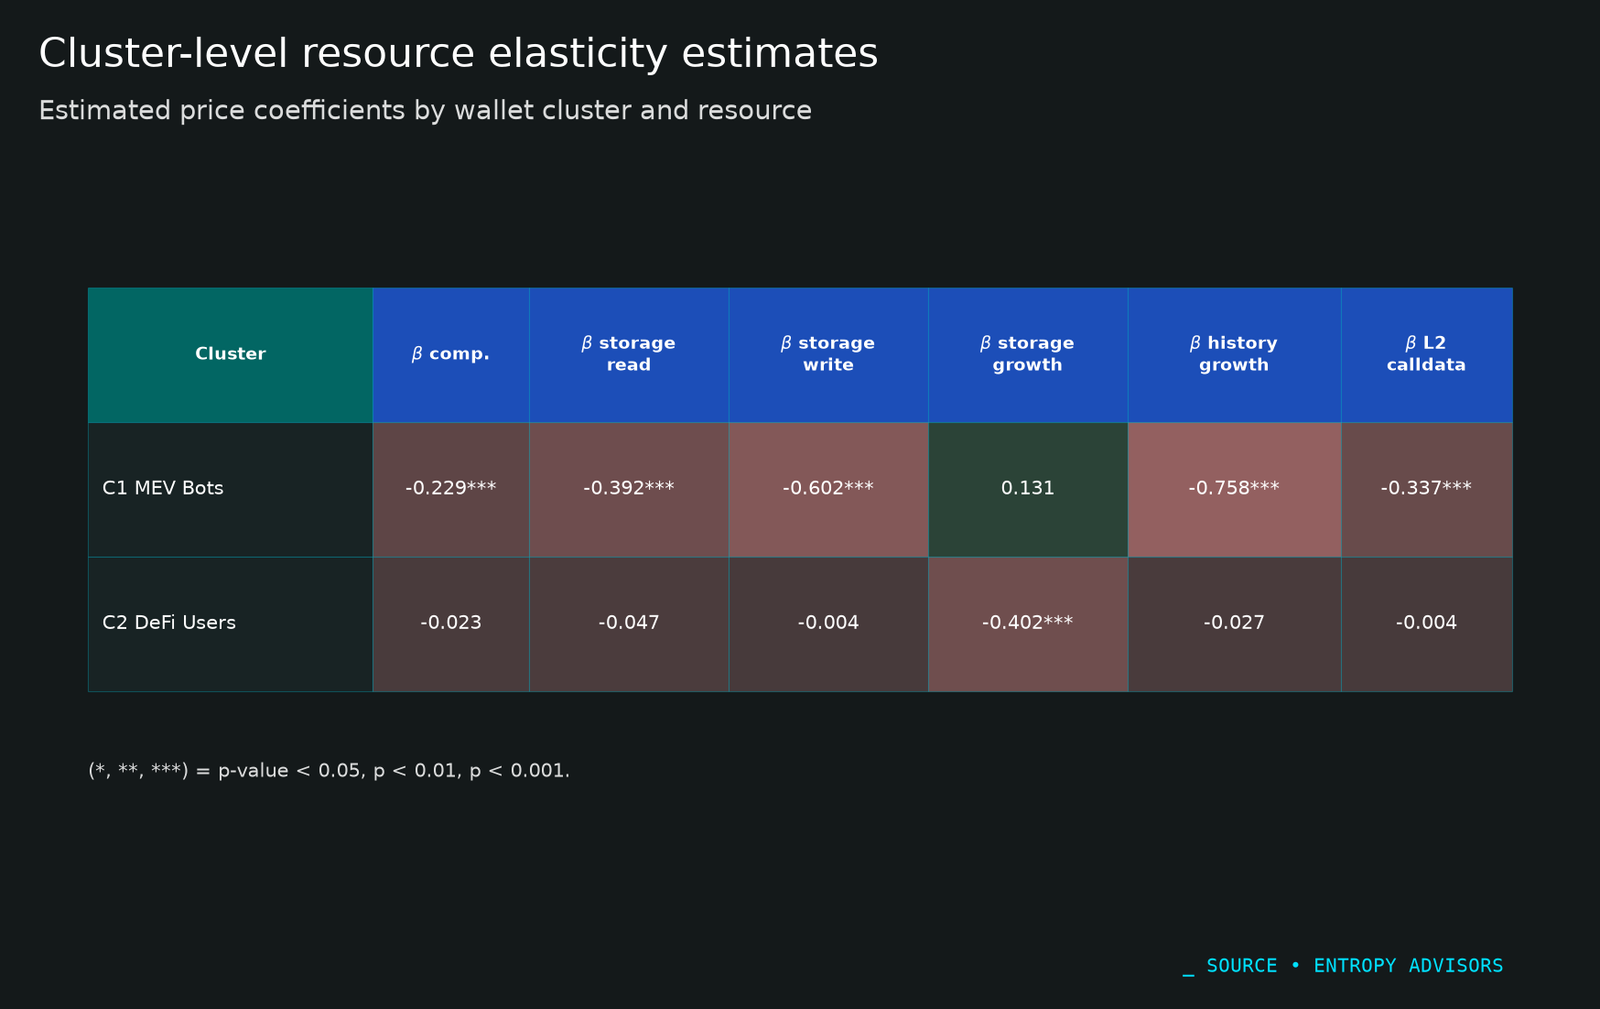
The final step applies the estimated price response to the historical workload at higher min base fee levels. For each cluster and resource, observed gas is shocked by the estimated response, then gas retention is measured as post-shock gas divided by observed gas over the same 2025-10-01 to 2026-04-28 window. The chart focuses on C1 and C2 because they are the two largest revenue-share clusters in the classified-wallet simulation.
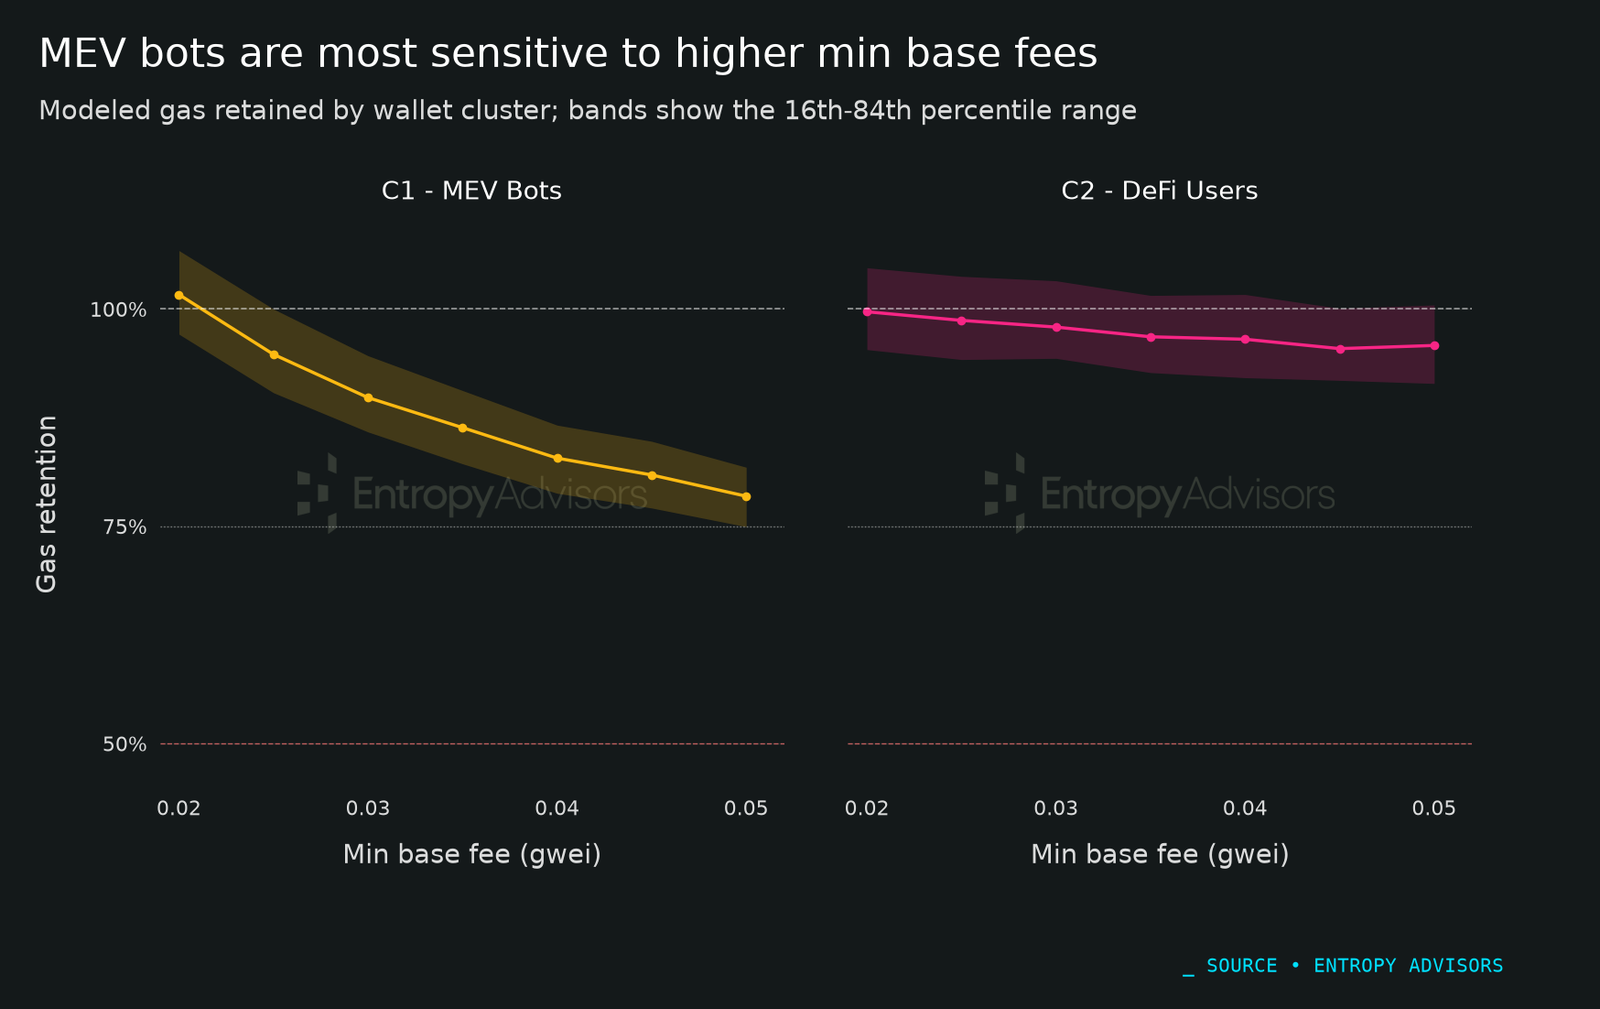
The main churn signal is concentrated in C1, labeled MEV Bots. C1 has the broadest set of statistically significant negative betas, including computation, storage read/write, history growth, and L2 calldata. In the stress test, C1 retention falls faster as min base fee increases, while C2 shows limited modeled churn through the displayed range.
Elasticity-Adjusted Revenue Simulation
The elasticity-adjusted simulation applies the cluster and resource gas-retention shocks to the same historical period, so it is directly comparable to the simulation without elasticity in Section 4. Its totals cover the classified-wallet scope rather than the full chain, roughly 85% of chain L2 fees, so the ArbOS 51 baseline on this scope is 2.39K ETH rather than the 2.87K ETH full-chain baseline used earlier. All comparisons in this section are against the classified-wallet baseline.
The central result is that elasticity changes the revenue picture very little at the current floor. At 0.02 gwei, elasticity-adjusted full-window revenue is 1.52K ETH ($4.85M), about 36.7% below the onchain ArbOS 51 baseline on the same scope, and within 0.1% of the without-elasticity figure. The modeled demand response is small at the current floor, and retained-gas assumptions matter more as the floor rises. Even so, the gap between the two simulations stays under one percent across every floor tested, from +0.1% at 0.02 gwei to about −1.0% at 0.05 gwei, so the demand response the model estimates is small relative to the mechanical effect of the pricing change itself.
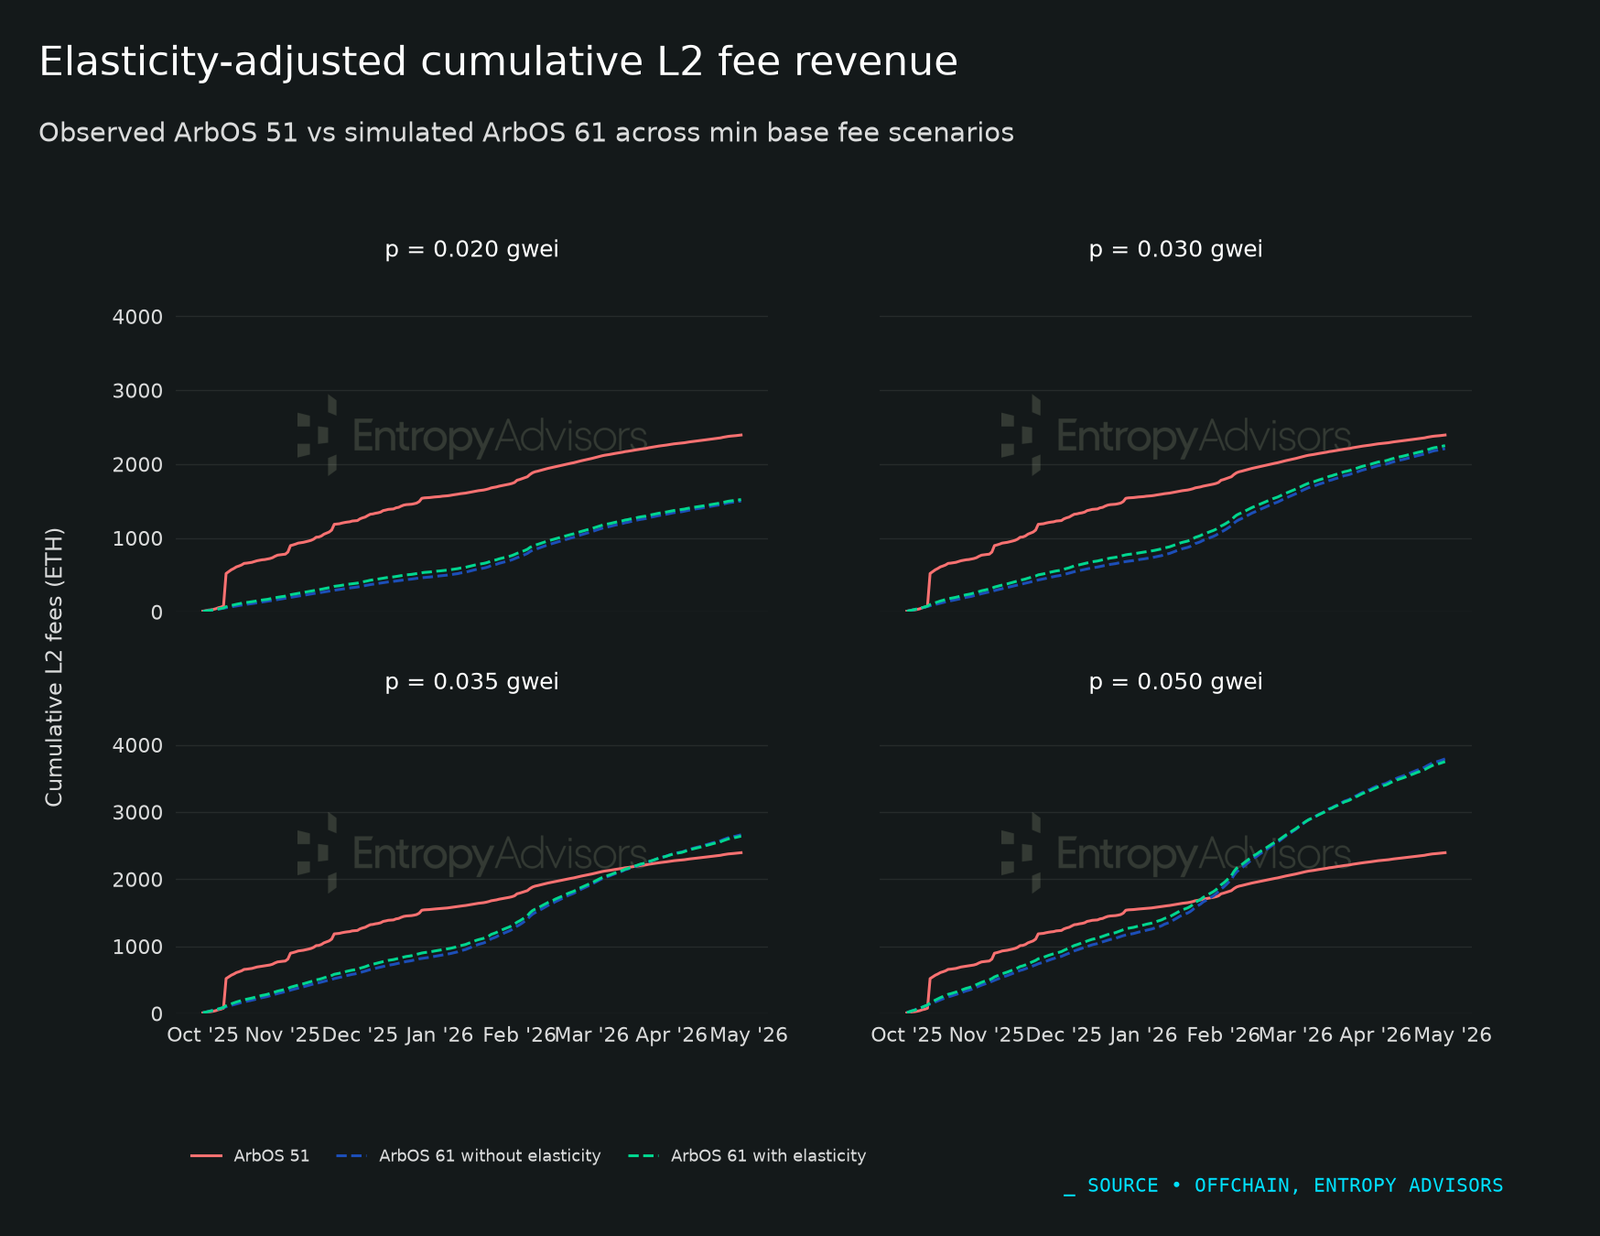
Raising the floor recovers revenue on nearly the same path as the without-elasticity simulation. The elasticity-adjusted run remains below the ArbOS 51 baseline at 0.03 gwei, at 2.25K ETH ($7.21M) or about 5.8% below, and clears full-window parity at roughly 0.035 gwei, at 2.64K ETH ($8.44M) or about 10.3% above. At 0.05 gwei it reaches 3.75K ETH ($11.98M), about 56.6% above baseline. Full-window parity with ArbOS 51 therefore lands near 0.035 gwei with elasticity, against roughly 0.032 gwei without it, a difference of about half a step on the floor.
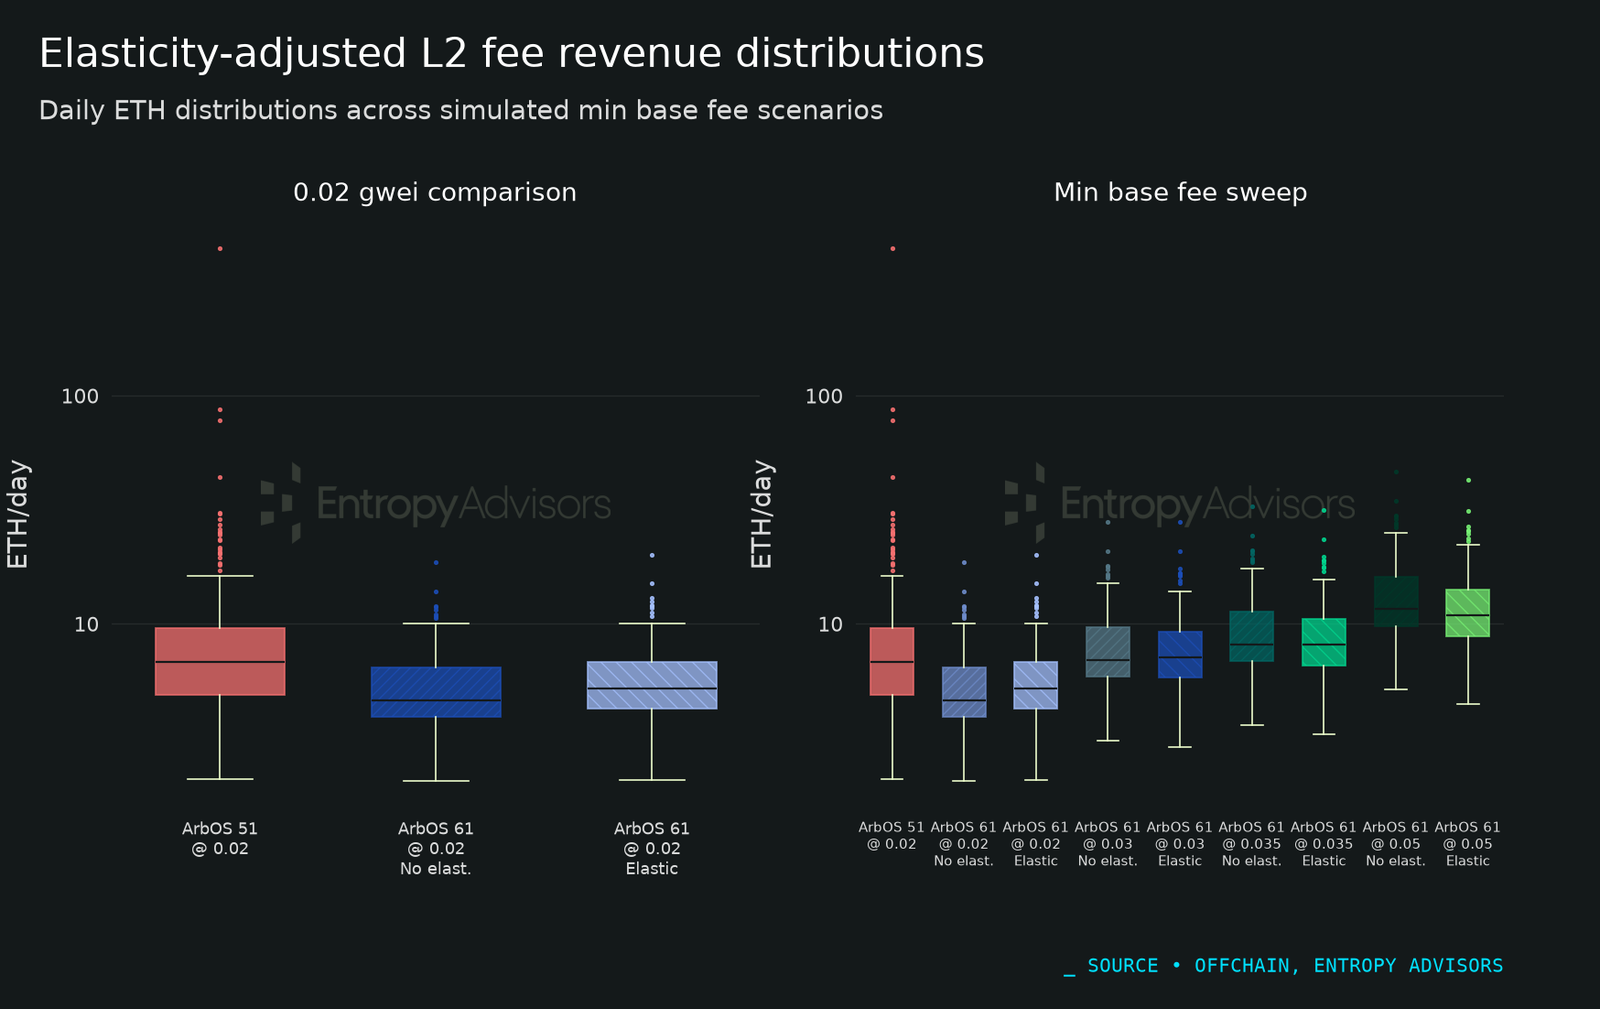
At higher floors the elasticity adjustment reduces retained gas relative to the simulation without elasticity, so the revenue gains from a higher floor should not be read as outcomes that hold without a demand response.
Capacity Impact on Arbitrum One
Under multi-gas pricing, capacity is determined by resource constraints rather than a single aggregate gas target. We define chain capacity as the amount of aggregate L2 gas that can be processed before the L2 base fee rises above the min base fee. For each second, total gas is split into resource shares, and activated ArbOS 60 capacity is the gas-per-second ceiling at which the first-ladder multi-resource constraint begins to bind. This produces a throughput ceiling that depends on the workload mix rather than on volume alone, and spare capacity is the unused share of that ceiling after realized gas usage is applied.
Against that definition, the modeled multi-gas design raises effective capacity substantially. ArbOS 51 is fixed at 7 Mgas/s before its launch and 10 Mgas/s after, while the modeled activated multi-gas ceiling holds near 16.2 Mgas/s across the full window. That is a median gain of about 130.9% over the pre-ArbOS 51 ceiling and about 62.2% over the post-ArbOS 51 ceiling, or about 62.0% across the full window. Median spare capacity under the modeled design runs from 65.2% pre-launch to 76.4% post-launch, which indicates the ceiling sits well above realized usage for most of the period.
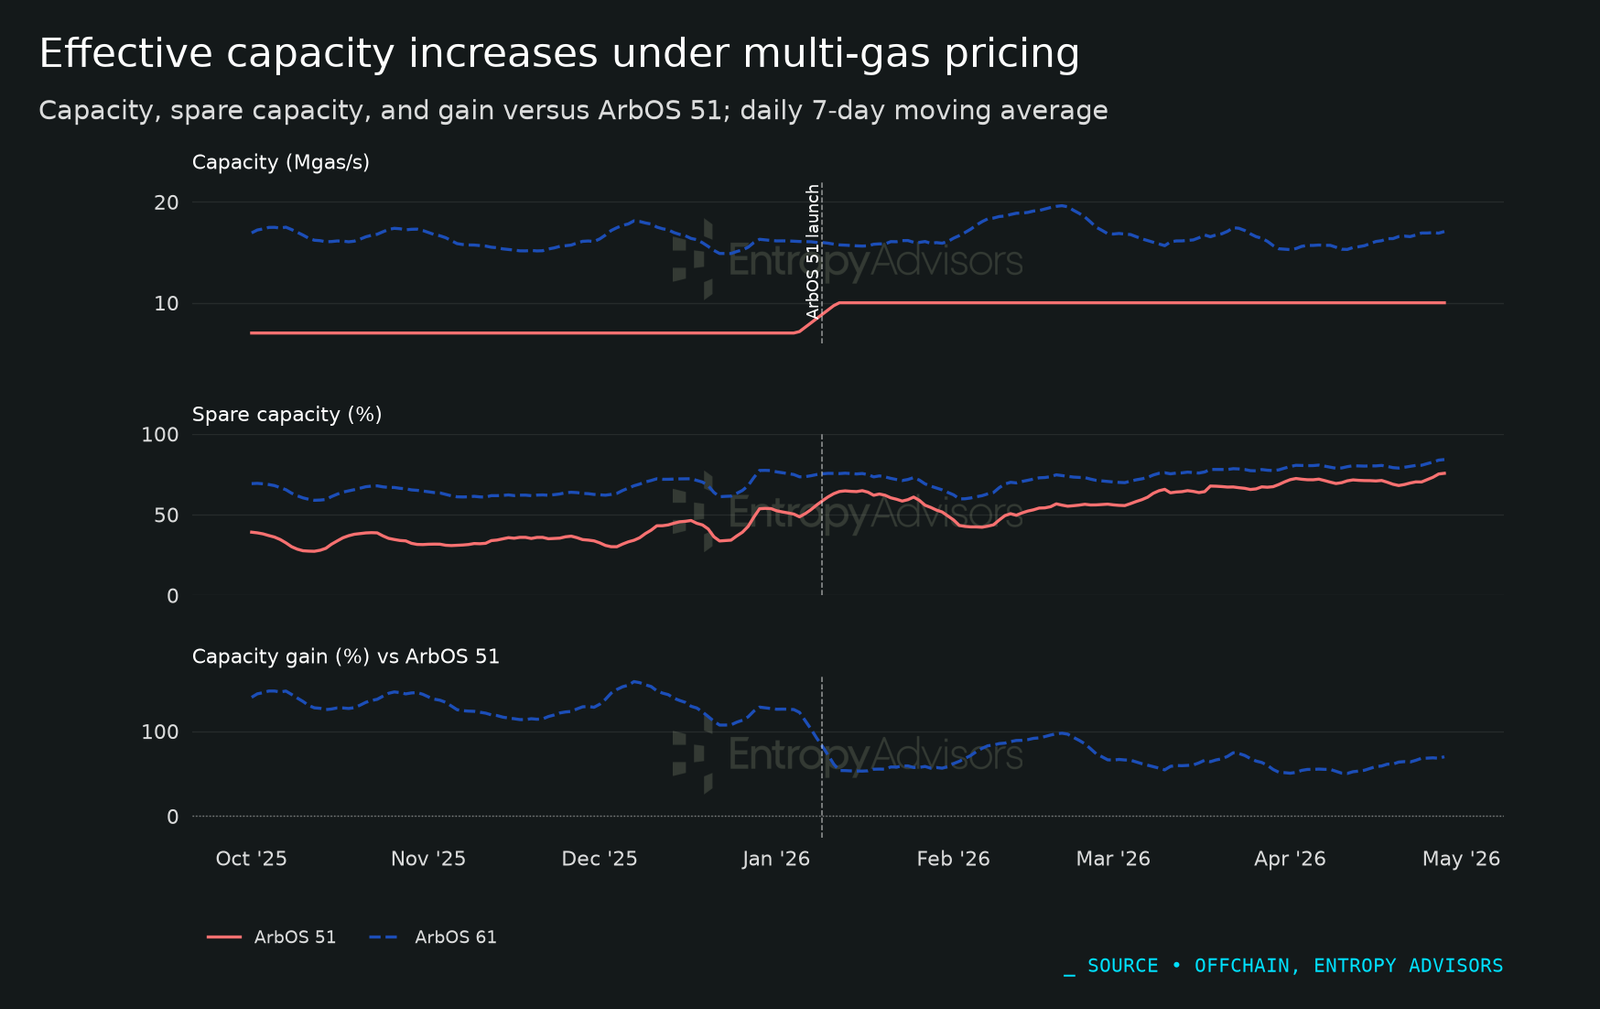
The capacity series stays materially above the ArbOS 51 ceiling throughout the period. Set 1 and Set 2 produce similar headline capacity because their first-ladder thresholds are identical, and they diverge only after backlog builds, so this steady-state ceiling view should not be read as a meaningful capacity difference between the two configurations.
Summary and Recommendation to Offchain
At a 0.02 gwei min base fee, the historical simulation estimates that activating ArbOS 61 multi-gas pricing would raise median effective capacity to about 16.2 Mgas/s, roughly +62% versus ArbOS 51 over the full window. The corresponding simulation without elasticity estimates 1.81K ETH of full-window L2 fees versus 2.87K ETH for onchain ArbOS 51, a -1.06K ETH or -36.8% change. The modeled activation would therefore reduce congested-day fee spikes and transaction costs, while also reducing DAO L2 fee revenue at the current floor.
The fee-volatility result should be read alongside the revenue result. Raising the min base fee is the main lever for revenue parity, but the appropriate level should not be fixed from this historical window alone. PGA may change congestion patterns, demand composition, and fee sensitivity (refer to the related AIP for further details).
Advising on Protocol Changes
Following this analysis, Offchain elected to leave Dynamic Pricing disabled on Arbitrum One and Nova. The decision drew on our revenue and capacity findings alongside Offchain's own engineering assessment, which weighed implementation complexity, performance tradeoffs at faster blocktimes, and the relative return of other scaling work. The Dynamic Pricing codepath remains in the node software but inactive, preserving the option to revisit it if conditions change.
Our research collaboration with Offchain is an example of the broader questions Entropy can help protocols and teams answer. When a parameter or mechanism change is on the table, the decision usually comes down to a complex tradeoff that can be difficult to fully understand. In this case that tradeoff was capacity against revenue, the size of which was not obvious until we ran the candidate configurations against real workload.
The methods in this study transfer directly to other protocol changes.
- Historical re-pricing: Our team can re-price observed onchain activity under a proposed mechanism and measure the revenue and cost impact before anything ships, holding real workload fixed so the comparison isolates the change itself.
- Demand elasticity by segment. Chain-wide averages hide the wallets that actually drive the outcome. We segment activity into behavioral clusters and estimate how each responds to price, which is what surfaced MEV bots as the primary churn risk here while DeFi users stayed close to inelastic.
- Capacity and congestion modeling. We can model how a change affects throughput ceilings and congested-day behavior, not just steady-state averages.
Many important protocol changes are difficult to reverse once it is live and priced into user behavior. Modeling it against historical data first turns an onchain vote into an informed decision rather than a bet.
If your team is weighing a protocol change and wants this kind of analysis reach out at contact@entropyadvisors.com